Get Risk Map
Note
This document has been machine translated.
This section explains how to use the API to retrieve EvWH risk map data in the xData Edge environment. The code and data used in the explanation can be downloaded from here The name of the EvWH container differs for each environment, so please check this method.
1. Submitting a risk map
A risk map is a set of records consisting of temporal and spatial attributes and the observed (or expected) risk values in that time and space. For details, see Common specifications for risk map data for details. In practice, it is common to use risk maps generated by prediction algorithms, etc., but this time we will use dummy risk map data prepared in advance.
Copy riskmap-files.zip to the VM where you installed Edge, and copy the inner sample_riskmap.sql to the EvWH container as follows.
kubectl cp sample_riskmap.sql evwhdb01-67466c9dc5-fcpl2:/opt/edge-evwh-db/
Next, run sample_riskmap.sql in the EvWH container to create tables and populate data as follows.
kubectl exec -it evwhdb01-67466c9dc5-fcpl2 -- /bin/bash
cd /opt/edge-evwh-db/
psql -d evwh -U evwh_admin -h evwhdb01 -f sample_riskmap.sql
2. Get risk map
API to get risk map (mapserv.riskmap) is used to acquire risk map data for EvWH.
To retrieve the risk map, you need to specify the theme name, time, space, and spatial granularity of the risk map data to be retrieved.
In this case, the risk map will be acquired under the following conditions.
- Theme:
sample_aqi_risk_5min.- Refer to schema
riskmapon EvWH, table `sample_aqi_risk_5min
- Refer to schema
- Time:
start_datetime>=2020-01-01 12:00:00andend_datetime<= `202020-01-01 15:00:00 - Space: 35 to 36 degrees latitude, 139 to 140 degrees longitude rectangle
An example of this implementation is get_riskmap.py.
When running get_riskmap.py on a VM with Edge installed, the results are saved to a file as follows and visualized in the next section.
python3 get_riskmap.py > riskmap.json
2. Visualization of the risk map
Here we will use QGIS for visualization; QGIS can be downloaded from here.
After launching QGIS, select OpenStreetMap under XYZTiles.
The result of running get_riskmap.py will be output in GeoJSON format, so drag and drop the file you saved in the previous section onto the map.
Since riskmap - result will be added to the layer, right-click and select “Zoom to Layer Area” from the menu.
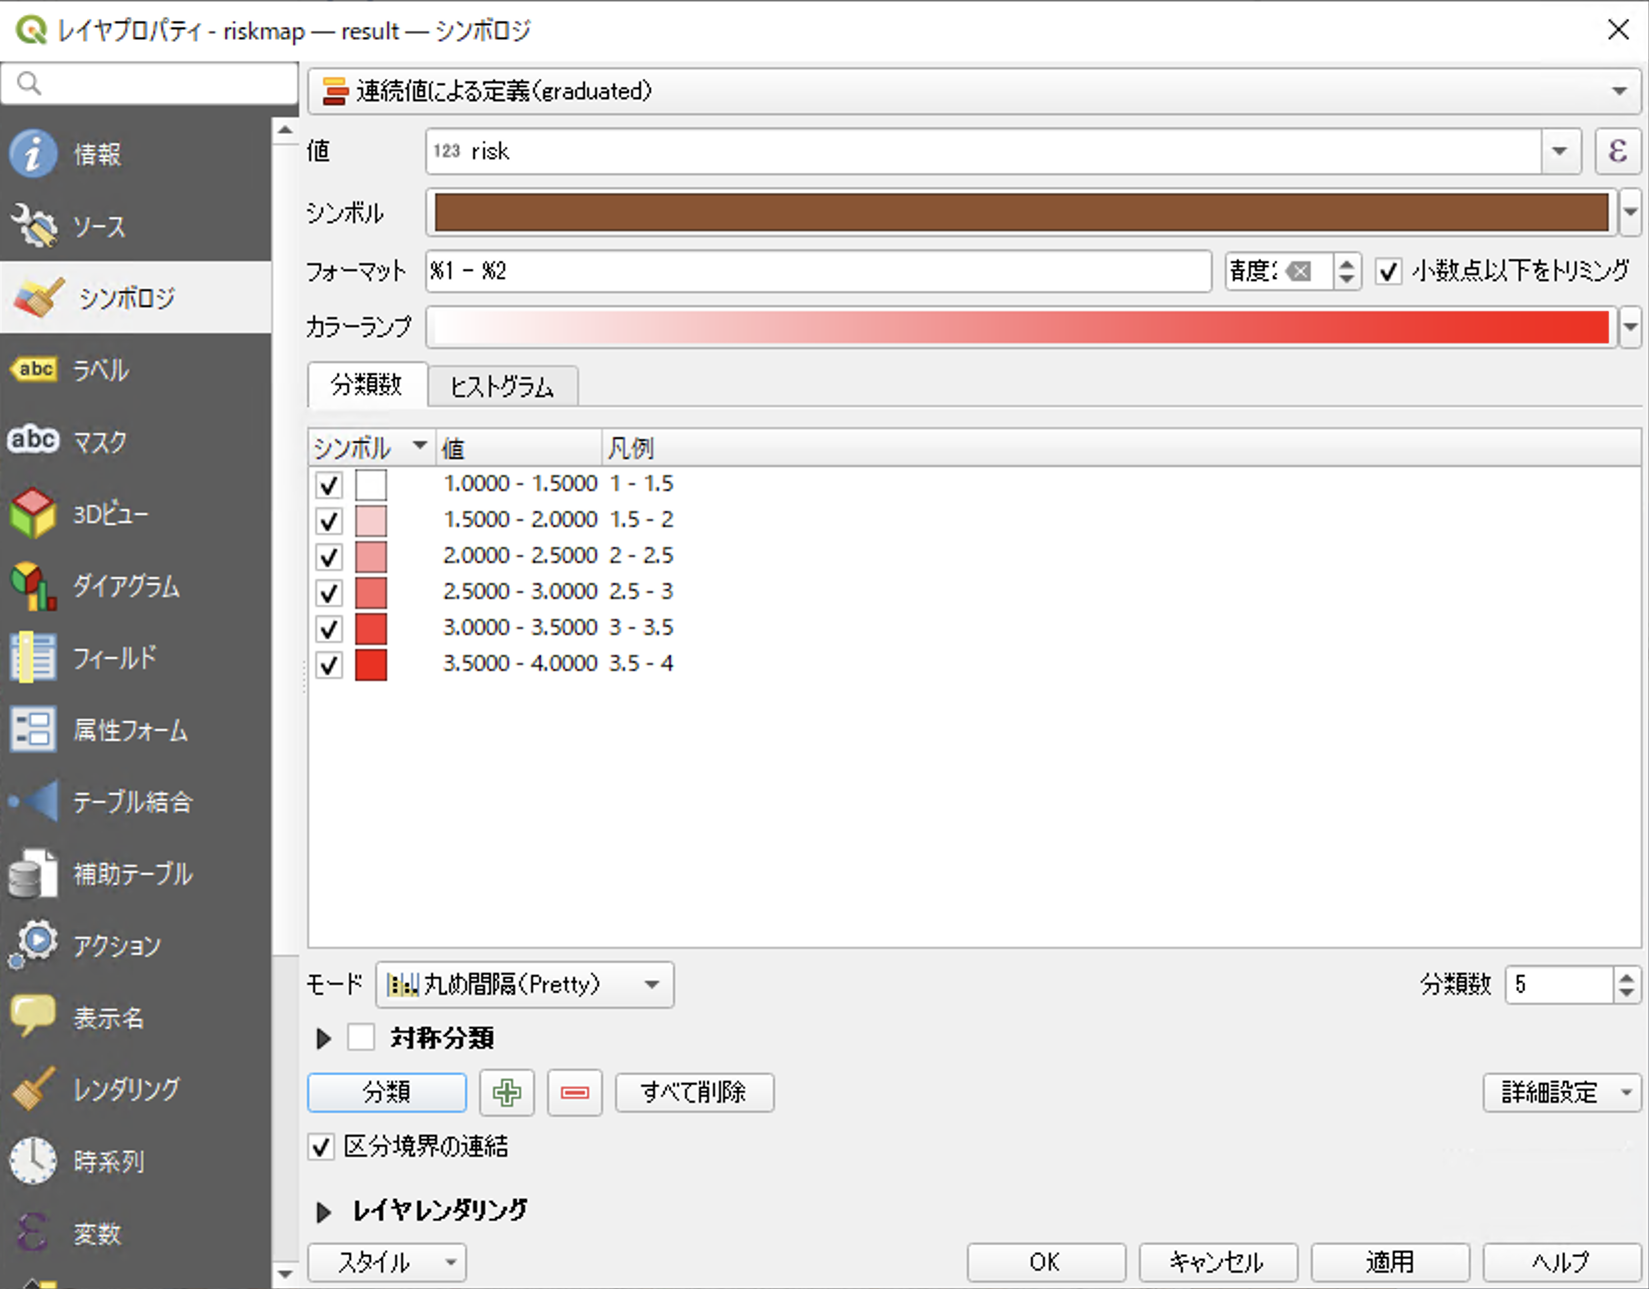
Next, select the properties of “riskmap - result” and set the following settings.
SymbolologymenuDefine by continuous value.- Set
valueto `risk - Press the
classificationbutton and create thesymbol-valuepair
! Figure 1
Time seriesmenu- Turn on `Dynamic Time Series Control
- Set
Date/TimeasSingle Field,FieldasdatetimeandDurationas5 minutes!
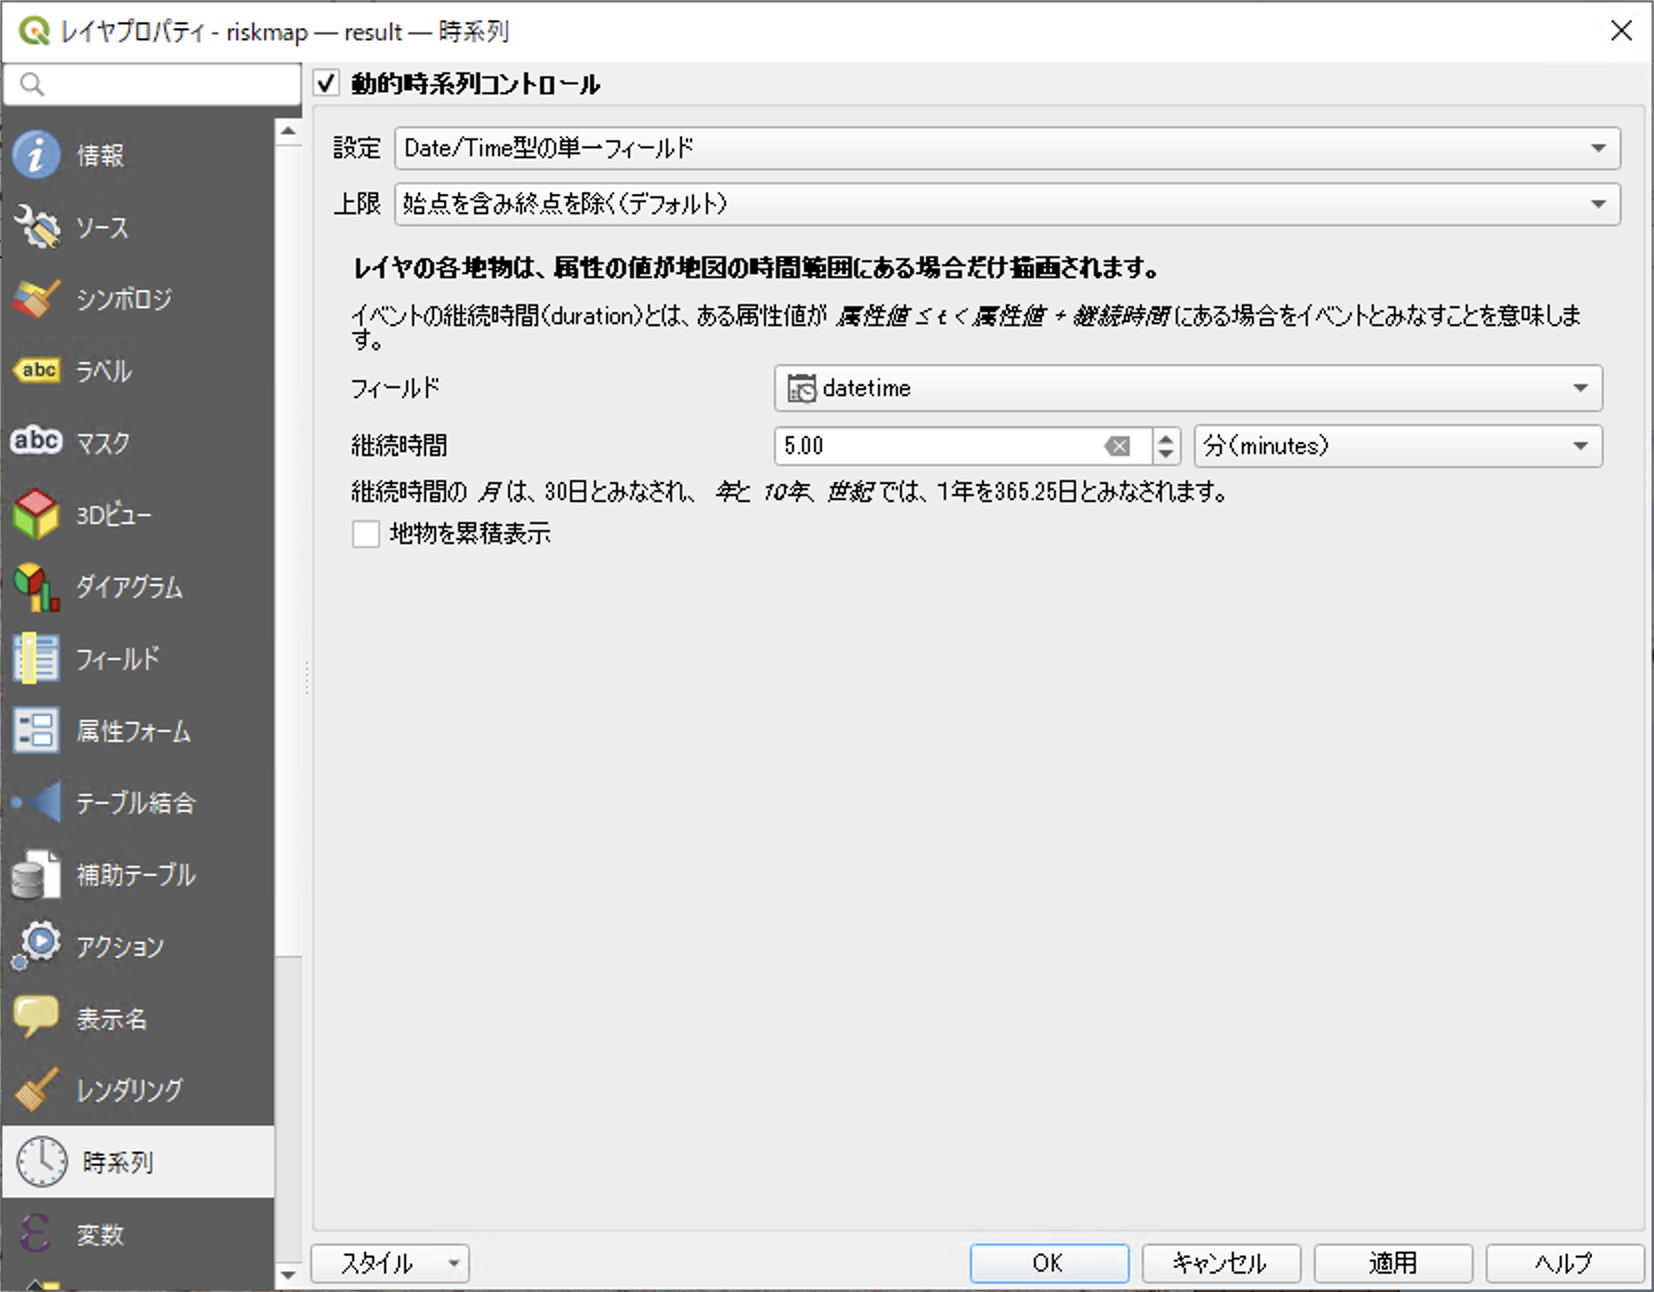
Press OK when you have completed the settings.
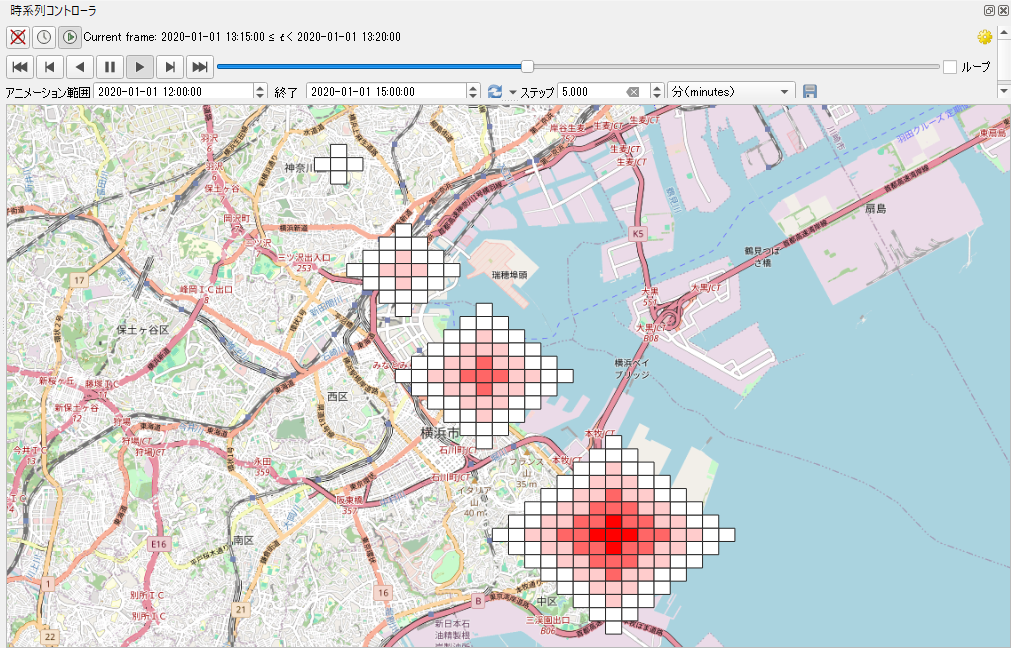
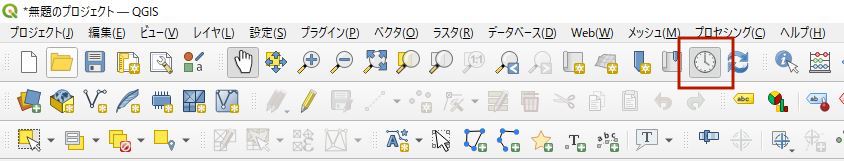
Next, press Time Series Controller Panel on the main QGIS screen to display the Time Series Controller.
From the Time Series Controller, press Animated Time Series Navigator , set
202020-01-01 10:00:00 to 202020-01-10 16:00:00 as the animation range and 5 minutes as the step, and press the play button. The risk is displayed in red to white.