Perform Route Search
Note
This document has been machine translated.
This section describes how to perform a route search using the API in the xData Edge environment. The code and data used in this explanation can be downloaded from here.
1. inputting road geometry data
Road geometry data is required to execute a route search. See here for road geometry requirements.
Copy the routing_sample.sql in routing-files.zip to evwh's VM and restore the data.
kubectl cp routing_sample.sql evwhdb01-xxxxxxxxxxxxxxxx-xxxxxxx:/opt/edge-evwh-db/
kubectl exec -it evwhdb01-xxxxxxxxxxxxxx-xxxxxxx -- /bin/bash
cd /opt/edge-evwh-db/
psql -d evwh -U evwh_admin -h evwhdb01 -f routing_sample.sql
2. Submitting a risk map
In order to perform a route search taking into account the risk values in the risk map, we need the risk map data. To submit a risk map, follow the procedure described in “1. Submitting a Risk Map” in “Getting Started Obtaining a Risk Map”.
3. Execute a route search
route search API(routing.dijkstra) is used to perform a route search considering the risk value of the risk map.
This time, route search is performed with the following conditions.
- Risk map theme:
sample_aqi_risk_5min.- Refer to schema
riskmapand tablesample_aqi_risk_5minon EvWH
- Refer to schema
- Risk weights: [0, 0, 0, 0, 10000, 10000, 10000, 10000, 10000, 10000, 10000].
- Find a route that avoids risk 4 or higher
- Starting point: 139.62317508963767, 35.46312510191533
- Minatomirai, near Shin-Takashima
- End point: 139.64200039914058, 35.451926042596774
- Minatomirai, near Red Brick Warehouse
- Start time: “2020-01-01 10:00:00+09”
- Map data to be used: “sample
- This time, the road data ('routing.sample_node','routing.sample_edge') submitted in 1 will be used.
Also, extract the geojson portion from the results for visualization.
An example of this implementation is routing.py.
When running routing.py on a VM with Edge installed, the results are saved to a file as follows and visualized in the next section.
python3 routing.py > routing.json
4. Visualizing routes
Here we will use QGIS for visualization; QGIS can be downloaded from here.
Visualizing the route
After starting QGIS, select OpenStreetMap under XYZTiles.
The result of running routing.py will be output in GeoJSON format, so drag and drop the file you saved in the previous section onto the map.
Since routing will be added to the layer, right-click and select Zoom to Layer Area from the menu.
Next, select “symbology” from the “routing” properties and set the width to 1mm.
Displaying the risk map
The risk map for the start of the route search is riskmap-20200101-1000.json in routing-files.zip.
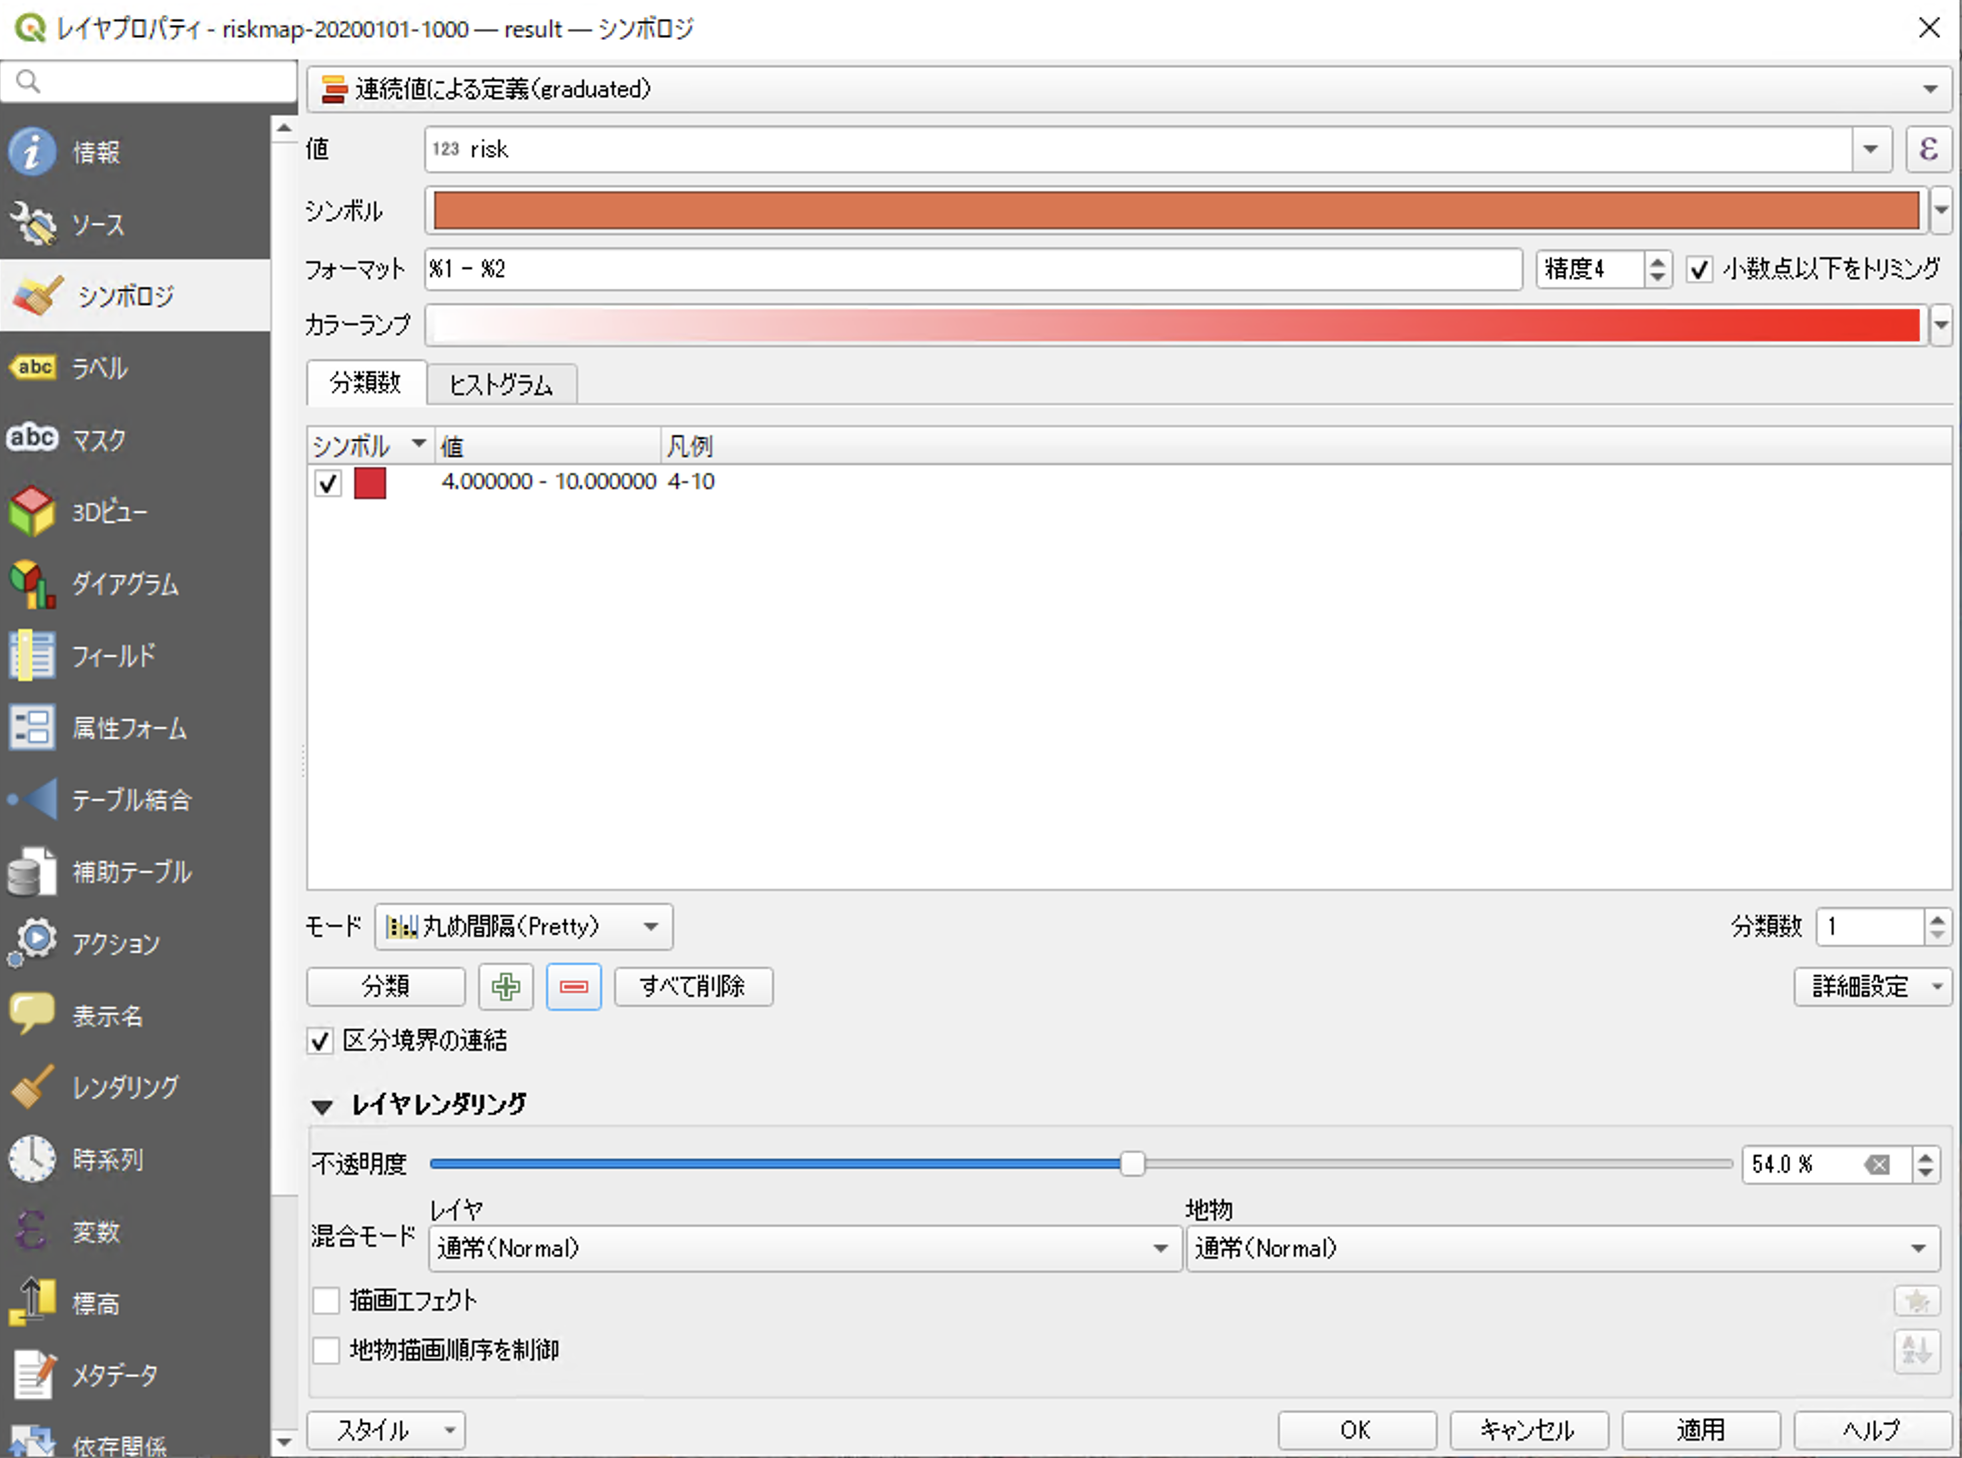
Drag and drop this on the map and set the following settings from the `riskmap - result' property selection.
Symbolologymenu- Change `definition by continuous value
- Set
valueto `risk - Press the
+button to the right of theclassificationbutton and add a classification - Set the value of the added classification to
4.000000-`10.000000 - set opacity to
50%!
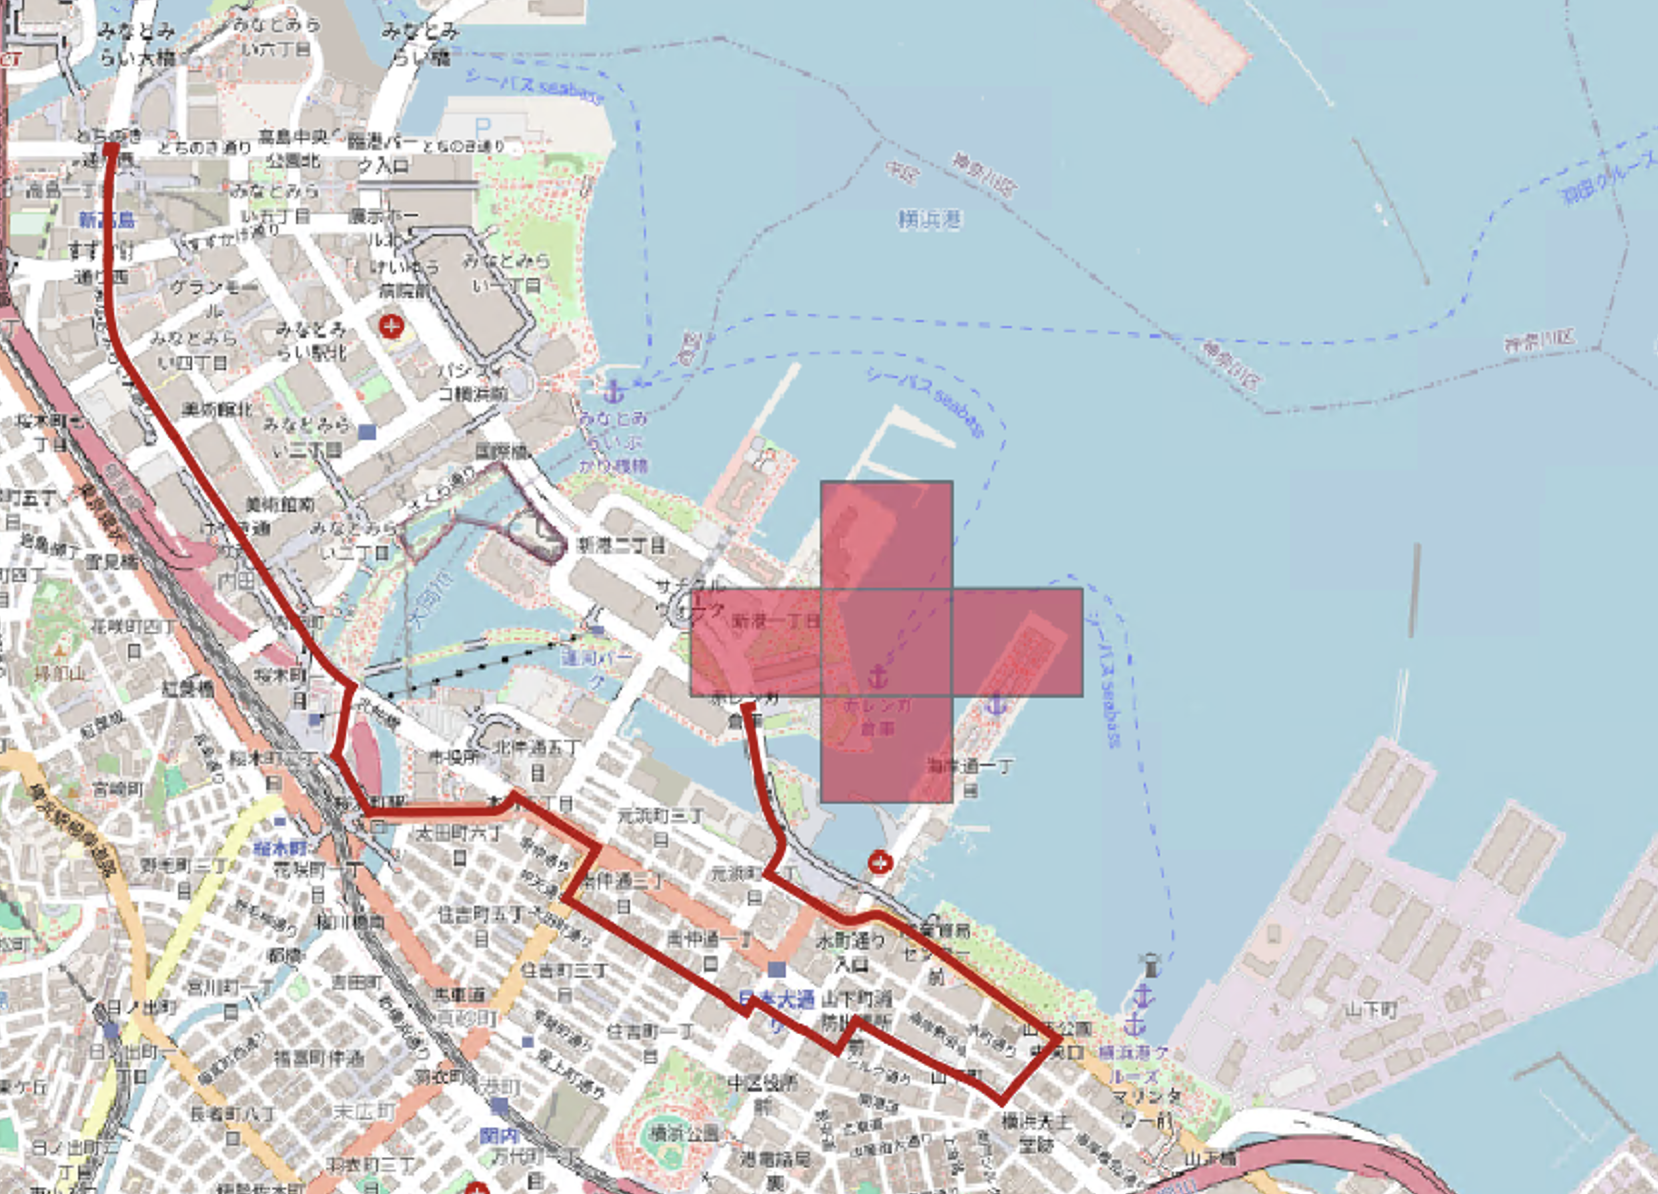
Confirmation of route search results
Since we specified the condition to avoid areas with a risk value of 4 or more in the route search, we can confirm that we have obtained a route that avoids areas with a risk value of 4 or more, which is shown in the display.